
In this blog, we shall understand NASDAQ 100 vs S&P 500 indices in greater detail from an investing perspective, as we examine their holdings, their performance in terms of risk and return, the consistency, and understand which index might be more suitable to have one’s portfolio.
When we see the entire list of U.S.-specific Mutual Funds/Index Funds/ETFs that are available for investment, we see a fair number of them either tracking the Nasdaq 100 or the S&P 500. And why not? After all, these two indices are composed of the United States’ largest companies.
Let’s begin with S&P 500 Index:
The S&P 500 index was launched in 1957, making it one of the oldest industries in operation within the United States.
As the name suggests, this index comprises stocks in 500 of the biggest stock exchange-listed companies in the US to put big in numbers.
The total market capitalization of all companies in the US is about $48 trillion. Of these $48 trillion, the companies in the S&P 500 represent about 40 trillion dollars or 83 percent of the country’s total market capitalization.
In other words, if the S&P 500 is doing well, then most times the US economy is doing well.
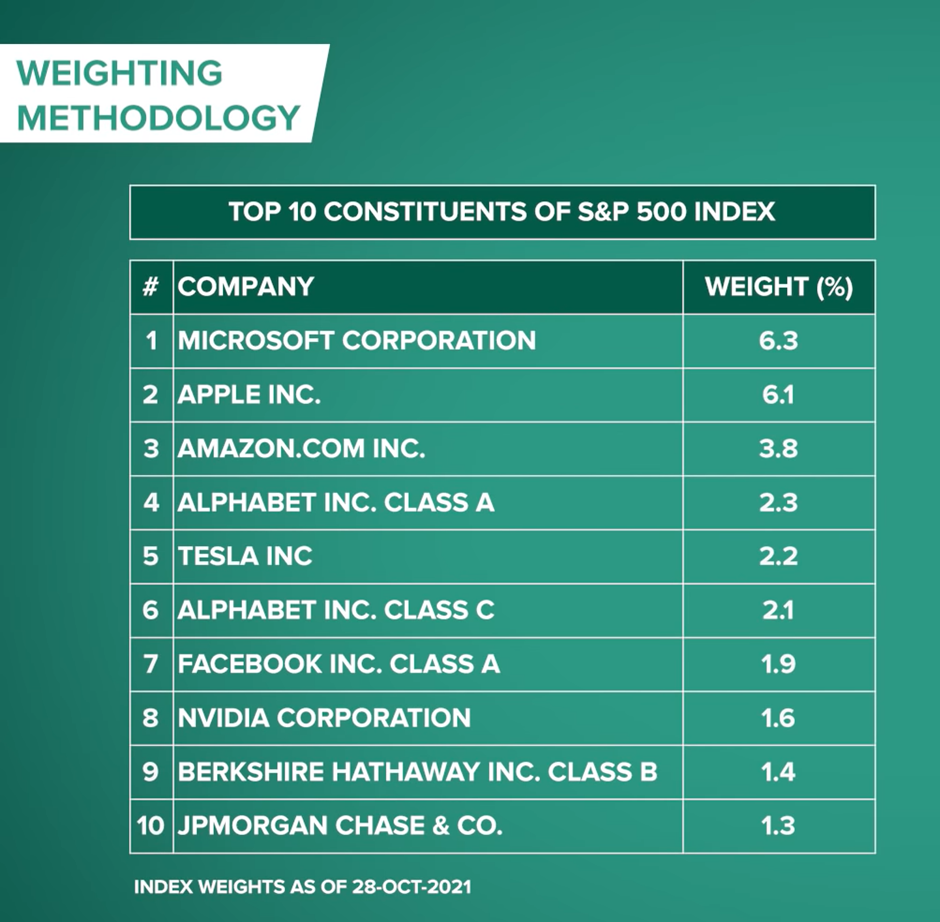
Now, as is the case with most indexes, the 500 companies within this index are assigned weights based on their free-float market capitalization.
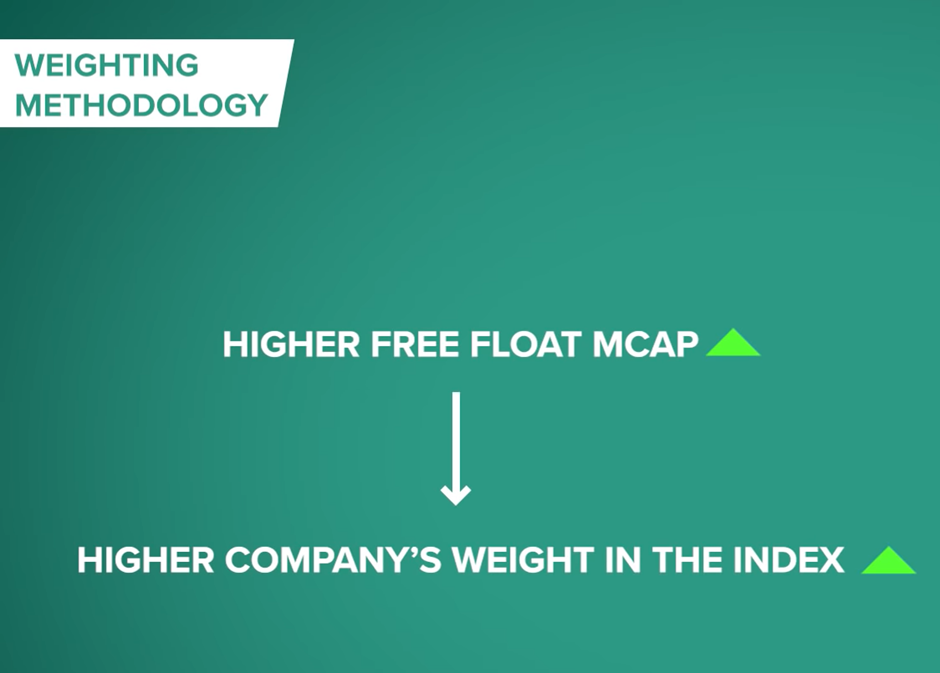
So with the S&P 500, as is the case with most indices around the world, the higher the free-float market capitalization, the higher is the weightage in the index.
The weights, of course, change from time to time by their stock prices.
E.g. Microsoft Corporation holds the highest rate in the S&P 500 index at 6.25% as of October 2021. However, just one month back, that is on the 30th of September. It was Apple that held the top spot in the index. So while the market capitalization is a very important variable to the index, some other factors also go into the selection of stocks for the S&P 500.
For instance, profitability matters, and barring a few exceptions, companies must be profitable to get into this index.
Companies that have recently gone public via an IPO must have at least 12 months of trading history. There are also some float and liquidity requirements, which keep out low public shareholding or thinly traded stocks.
Finally, the selection of companies goes through an approval process, which is conducted by an index committee. One of the mandates of this index committee is to keep the S&P 500 representative of the US stock market.
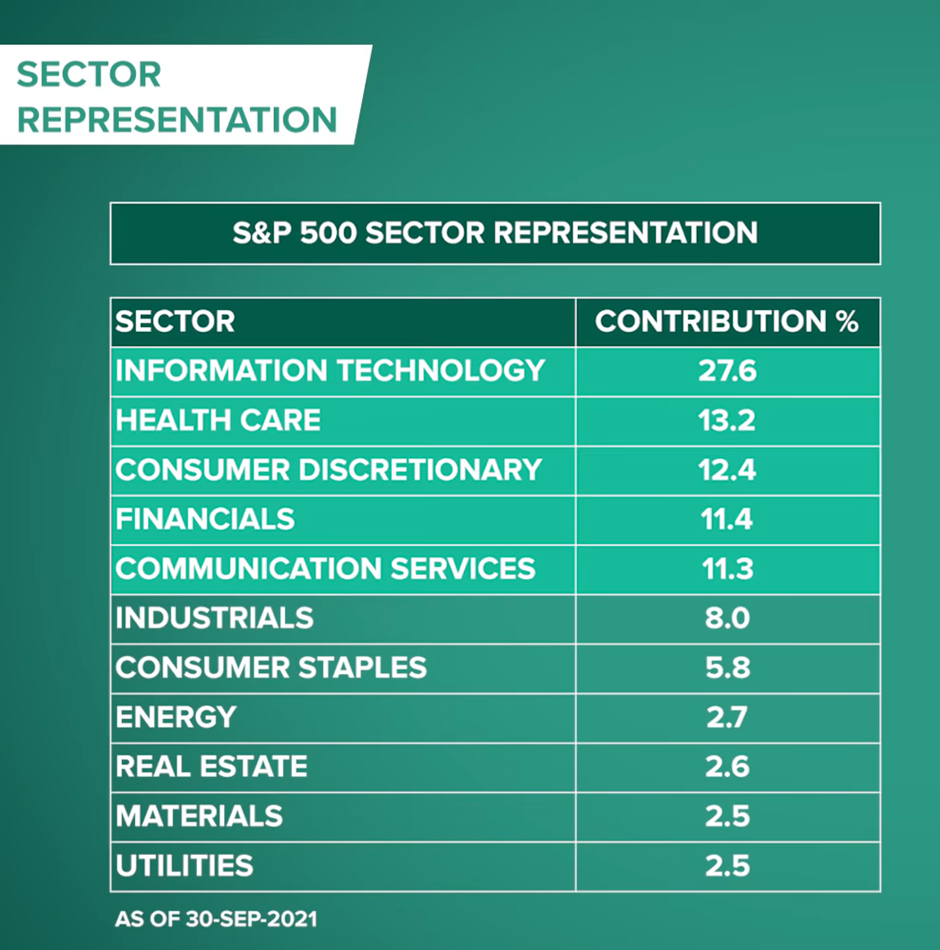
Sectoral Representation:
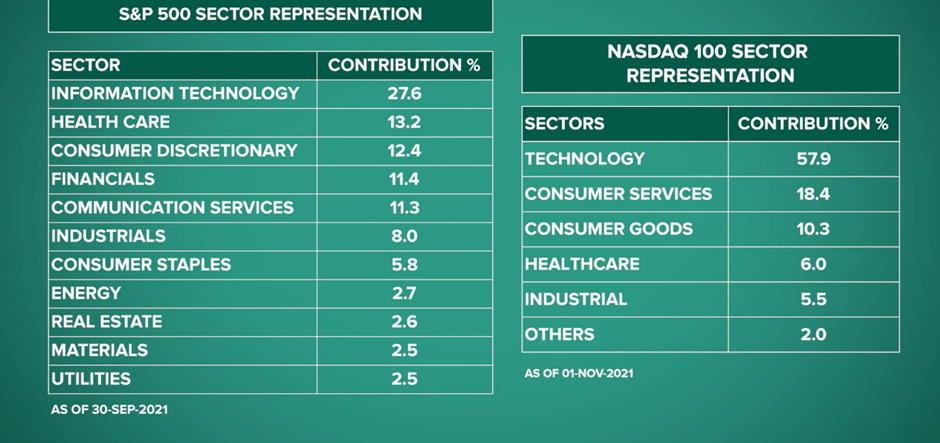
The S&P 500 represents 11 key sectors with information technology, health care, consumer discretionary, financial, and communication services forming the bulk of it.
Now, when one sees relatively young companies like Amazon, Alphabet, and Facebook within the top 10.
One does wonder at what rate are index constituents changing in this index? One study reveals that an S&P 500 company’s longevity in the index has reduced from 38 years in the early 1980s to around twenty years now, and is projected to go down to 12 years in the latter half of this decade.
What’s ushering this change are newer technologies and ways of doing business, including digitization, alternative energy, artificial intelligence, the sharing economy, big data, blockchain, 3D printing, hyperloop, and dozens of other things that are yet to be commercialized.
The S&P 500 of the future will be a lot different than the one that’s presently in front of us.
Let’s now Look at Nasdaq 100:
The Nasdaq 100 index was launched in 1985 and represents the 100 biggest non-financial companies listed on the Nasdaq Stock Exchange.
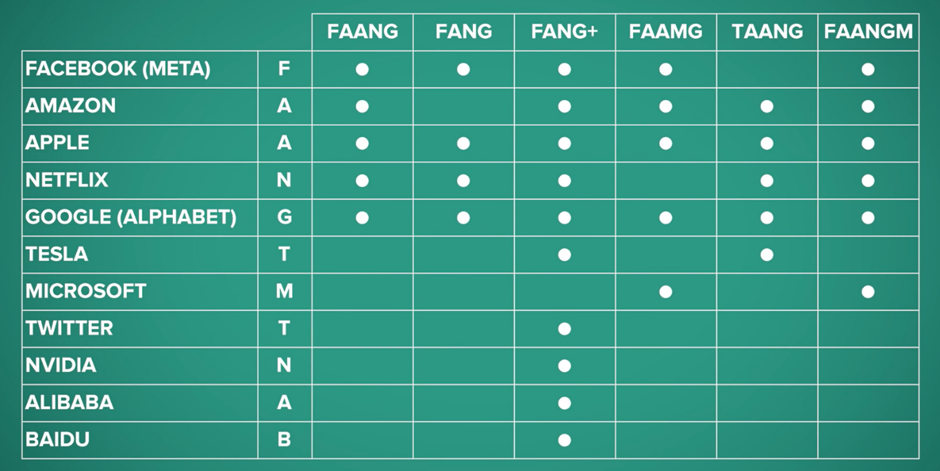
By excluding financials, the Nasdaq 100 is dominated by tech majors, which often go with a popular acronym called the FAANG stocks ( Facebook, Apple, Amazon, Netflix, and Google.)

Now, with Facebook changing to META. I’m not sure what’s going to happen to the FAANG, but if you add other trillion-dollar companies like Microsoft and Tesla to the mix, then there are quite a few naming combinations that are floating around.
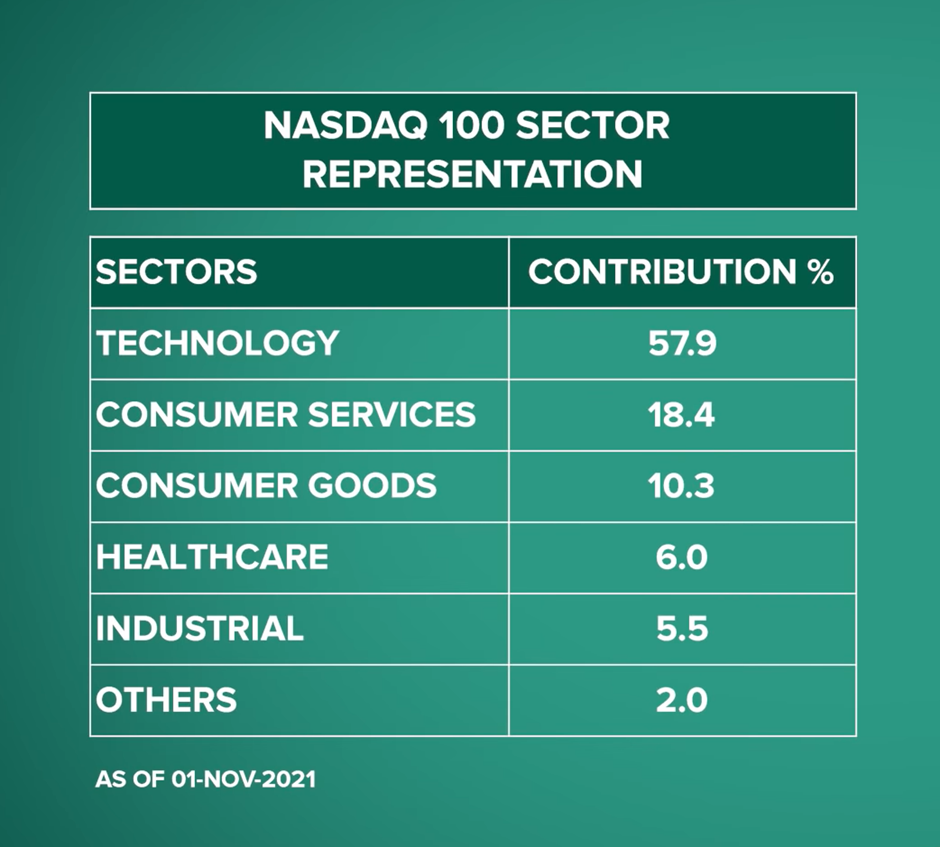
The point is technology companies are big in the Nasdaq 100 index, together, they account for 57% of the index allocation, which would come as a surprise to some, as the general expectation is that the Nasdaq would be holding a much higher percentage in technology companies.
Other than technology, there are several consumer companies within the Nasdaq, which include firms like Starbucks, Macy’s, Domino’s, PepsiCo, and others.
But, given that the majority is with technology and also internet companies, plus the fact that the number of companies is limited to just 100, it won’t be wrong to classify the Nasdaq 100 as a tech-heavy, large-cap growth index.
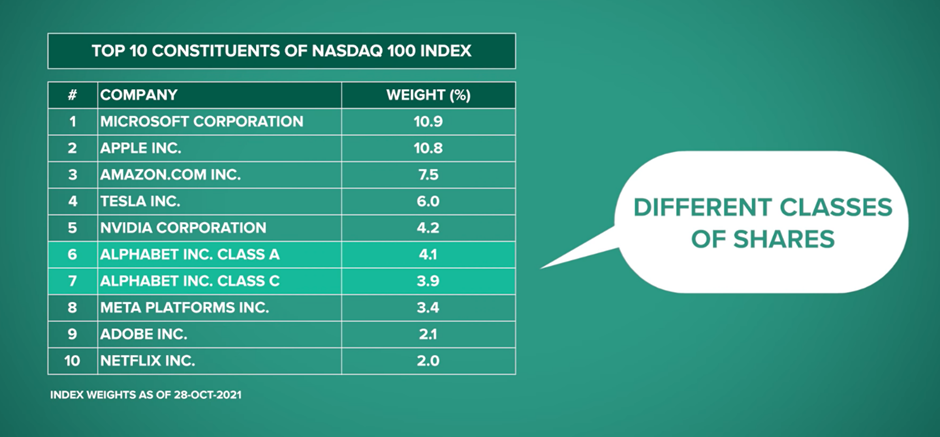
What’s notable here is that the top 10 companies contribute to 55 percent of the index’s weight, which makes the Nasdaq 100 one of the world’s most concentrated industries.
It’s not entirely bad when you know that you are getting a concentration of the world’s biggest and most innovative companies. But this is a point that will surely revisit in the next section when we compare the Nasdaq 100 with the S&P 500 index.
Differences between the Nasdaq 100 vs S&P 500.
Let’s point out some of the differences between the Nasdaq 100 vs S&P 500.
- Firstly, the Nasdaq 100 has 100 companies, the S&P 500 has 500 of them. Technically the Nasdaq 100 has 109 constituents and the S&P 500 has 505 components in it. These extra names and faces are on account of a few companies having multiple classes of shares. But net-net there are 100 and 500 companies, respectively.
- The second point of difference is on the sectoral representation. The S&P 500 has a more diverse range of sectors 11 to be precise, while the Nasdaq 100 has a narrower mandate with five significant sectors. Also, as was pointed out earlier, financials are not a part of the Nasdaq, which means this index is missing a systemically important industry within its scope.
- The third difference between the Nasdaq 100 and S&P 500 is the concentration element. The Nasdaq 100 is concentrated in terms of companies and sectors, with the top 8 companies comprising over 50% of the index. Also, in terms of sectors, technology as a single sector presently has a 57% weightage. On the other hand, the S&P 500 is less concentrated, with technology having less than 30% in weightage, which of course reduces the concentration risk for the investors.
These are some key visible differences between the two indices Nasdaq 100 vs S&P 500.
Let’s now look at how they have fared from a risk and return perspective.
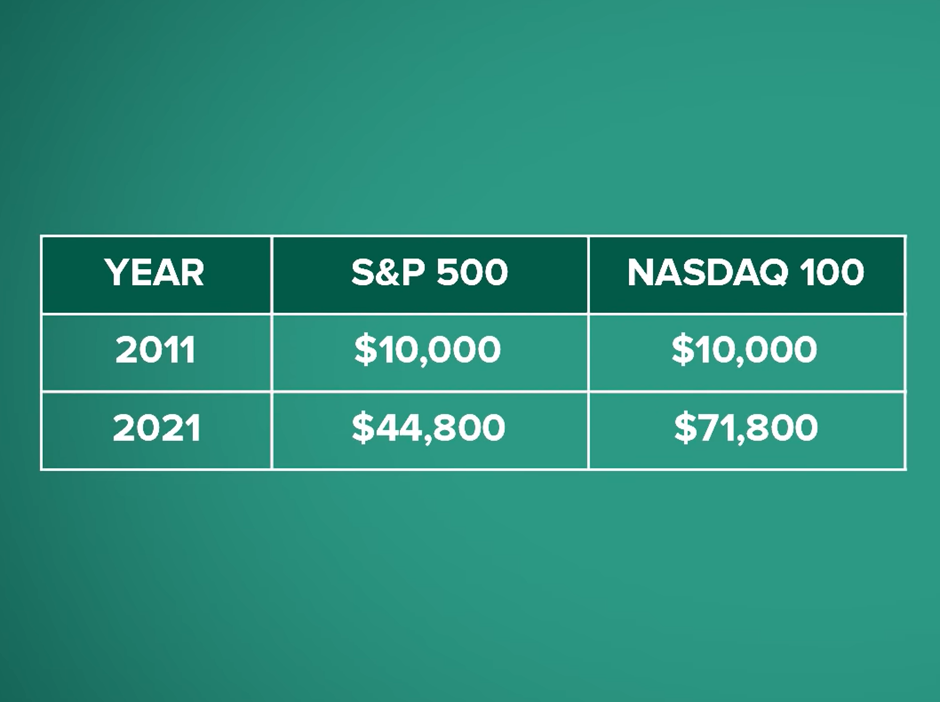
Let us start with returns, and we see that the Nasdaq 100 has significantly outperformed S&P 500 in terms of performance over longer periods.
If one had invested $10000 in November of 2011, this would be the value.
Comparing Yearly Returns over Years:
On an annual basis to the Nasdaq 100 has outperformed the S&P 500 in most years within the last decade. This outperformance has sometimes been by a big margin, as we can see in 2015, 2017, 2019, and of course, in 2020.
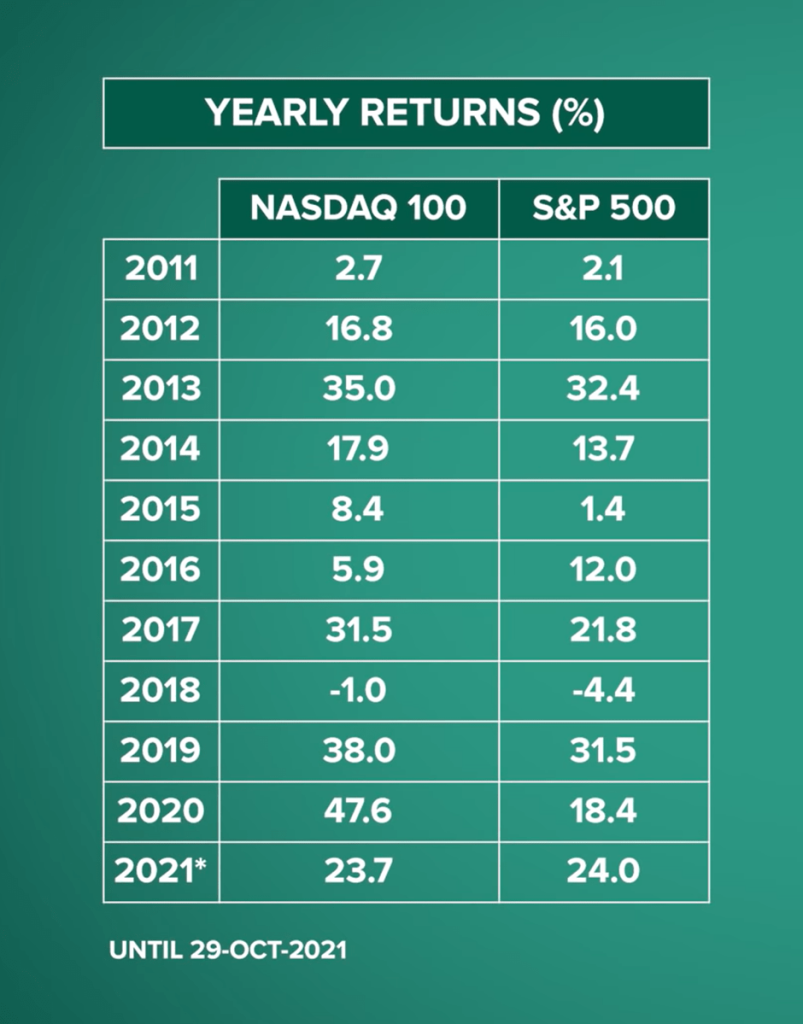
What’s even more interesting is that while the Nasdaq 100 has outperformed, it has also managed to keep its annual volatility around the 21 percent mark, which is quite similar to the S&P 500’s volatility over the last 10 years.
Honesty, we found this a little surprising when one factor is that the Nasdaq 100 has a lot fewer stocks and is a heavily concentrated portfolio in terms of companies and sectors as compared to the S&P 500.
So at least from a risk-return equation, the Nasdaq 100 has certainly outdone the S&P 500 in the past decade. There is no denying that the FAANG stocks have been the engine that has driven the Nasdaq for much of the last decade.
Facebook, Apple, Amazon, Netflix, and Google, in addition to serving millions and billions of consumers around the world, have also set the stock market’s on fire.
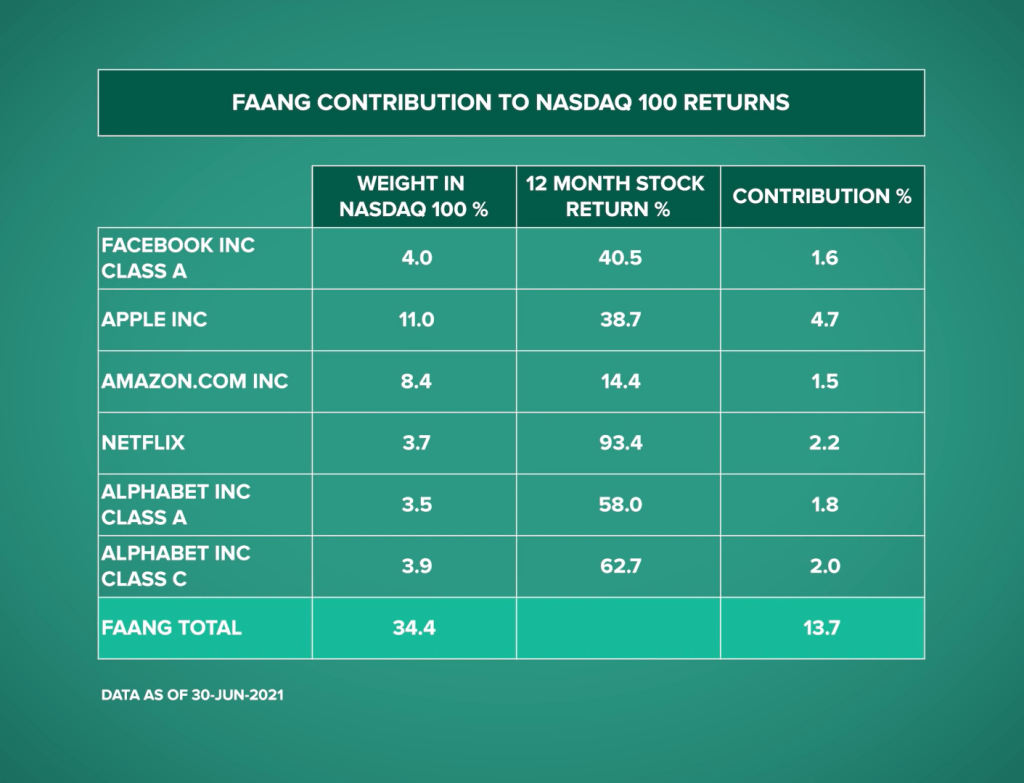
These five companies account for almost 35 percent of the Nasdaq 100 in terms of allocation and contribute to over 40 percent of the returns of that index, which is another way of saying that the Nasdaq 100 is more sensitive to the FAANG share prices than that of other smaller companies.
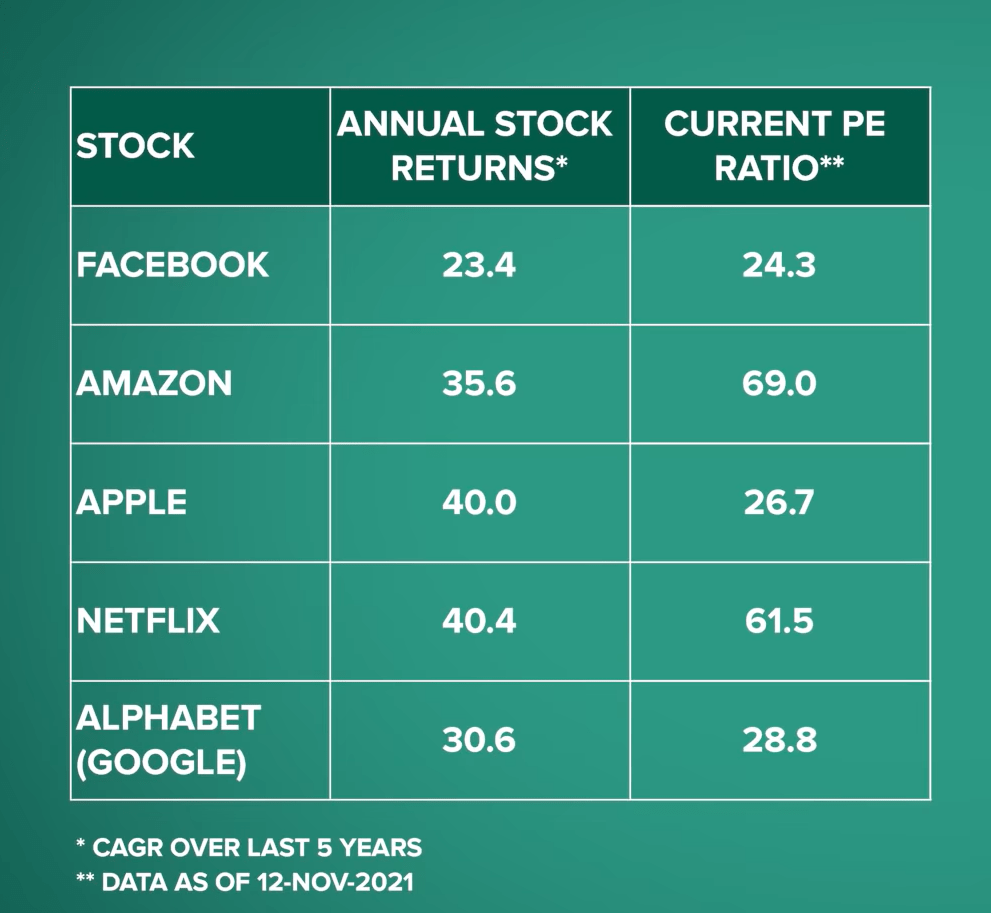
Now, given this sensitivity, a question that often pops up with investors is, are these are the 5 stocks too expensive?
The 5 FAANG stocks have done exceedingly well over the last five years, with annualized returns of anywhere from 23 percent to 40 percent. But you look further, these stocks are presently available at a relatively high price to earnings multiple, which implies that investors see a lot more growth in these companies, and many of the FAANG stocks have done just that in the recent past.
The FAANG stocks are widening that moat, which makes it difficult, almost impossible for a competitor to come in and take away their dominant position.
While we have not done any valuation in this blog, the attractiveness in FAANG stocks comes from a combination of having an established business that is generating billions in cash flows, strong competitive advantages, and a long growth frantic.
What Should Investors do ?
From a performance point of view, the Nasdaq 100 is the outright winner. Year after year, the Nasdaq 100 has edged past the S&P 500. And what came as a surprise to us is that they have done this without veering too much in terms of volatility.
However, with the Nasdaq 100, one can’t hide behind the fact that the index is a dramatic one with a massive tilt towards technology stocks, and like every thematic fund, there are likely to be up and down cycles.
In our view, this up-down down cycle is not likely to be in terms of the demand for technology, but more so in terms of valuations which can get stretched very quickly and more difficult to justify as companies become even bigger.
This sort of makes the decision is a bit easier now. If one wants to invest in the growth of the entire US economy that is in the banking, consumer goods, energy technology, etc., then the S&P 500 fits in right away.
It has diversity, has a long track record. It has large-cap companies and these companies are systemically important not just for the US, but for the entire world.
However, if one is keen on participating in US technology and internet firms, then it’s better to opt for the Nasdaq 100 and own a piece of Apple, Microsoft, Amazon, Tesla, Facebook, Alphabet, and other emerging and established tech companies.
Conclusion:
In either case, ensure that the fund you choose fits in properly with your overall portfolio allocation. Until that, mutual fund investments are subject to market risks, read all schemes-related documents carefully.
Hope you liked our comparison article on NASDAQ 100 vs S&P 500 , please read our other article on “ETF Vs Mutual Fund Vs Index Fund – Difference You Must Know“
